One month, two channels
Charity name and campaign labels are redacted for confidentiality. Every performance figure below is unedited, straight from the ad accounts.
All figures are in Singapore dollars (S$).
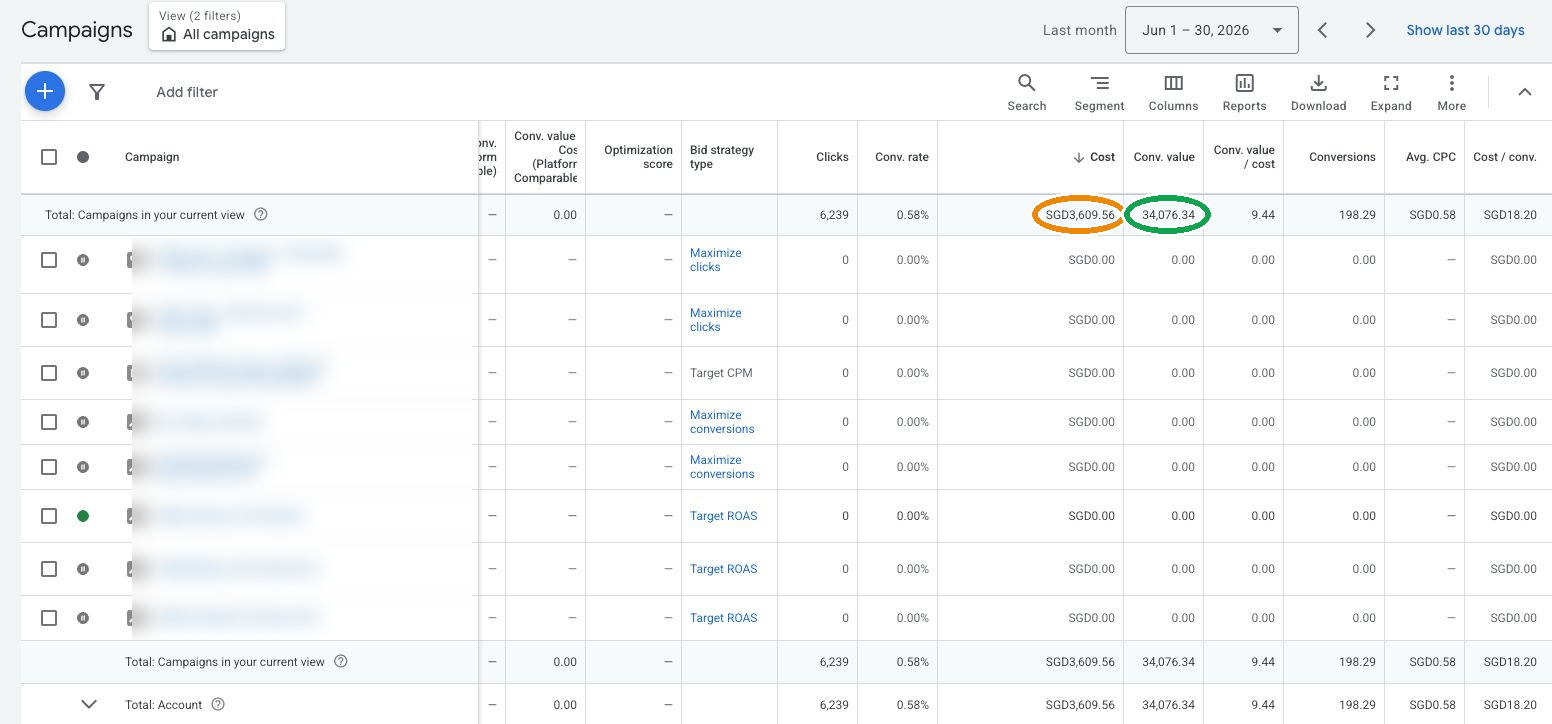
Google Ads — paid
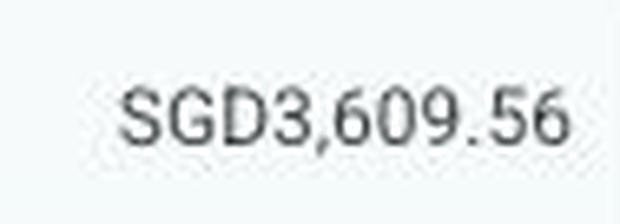
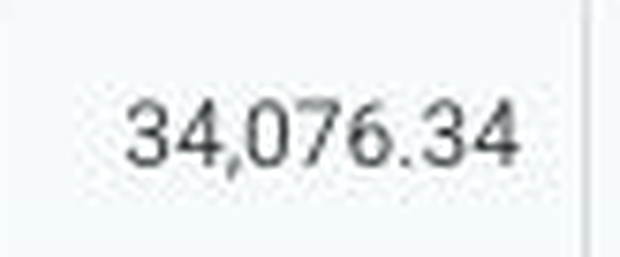
June 2026 · S$3,609 spent · S$34,076 in tracked donations · 9.4× return
Meta Ads — paid
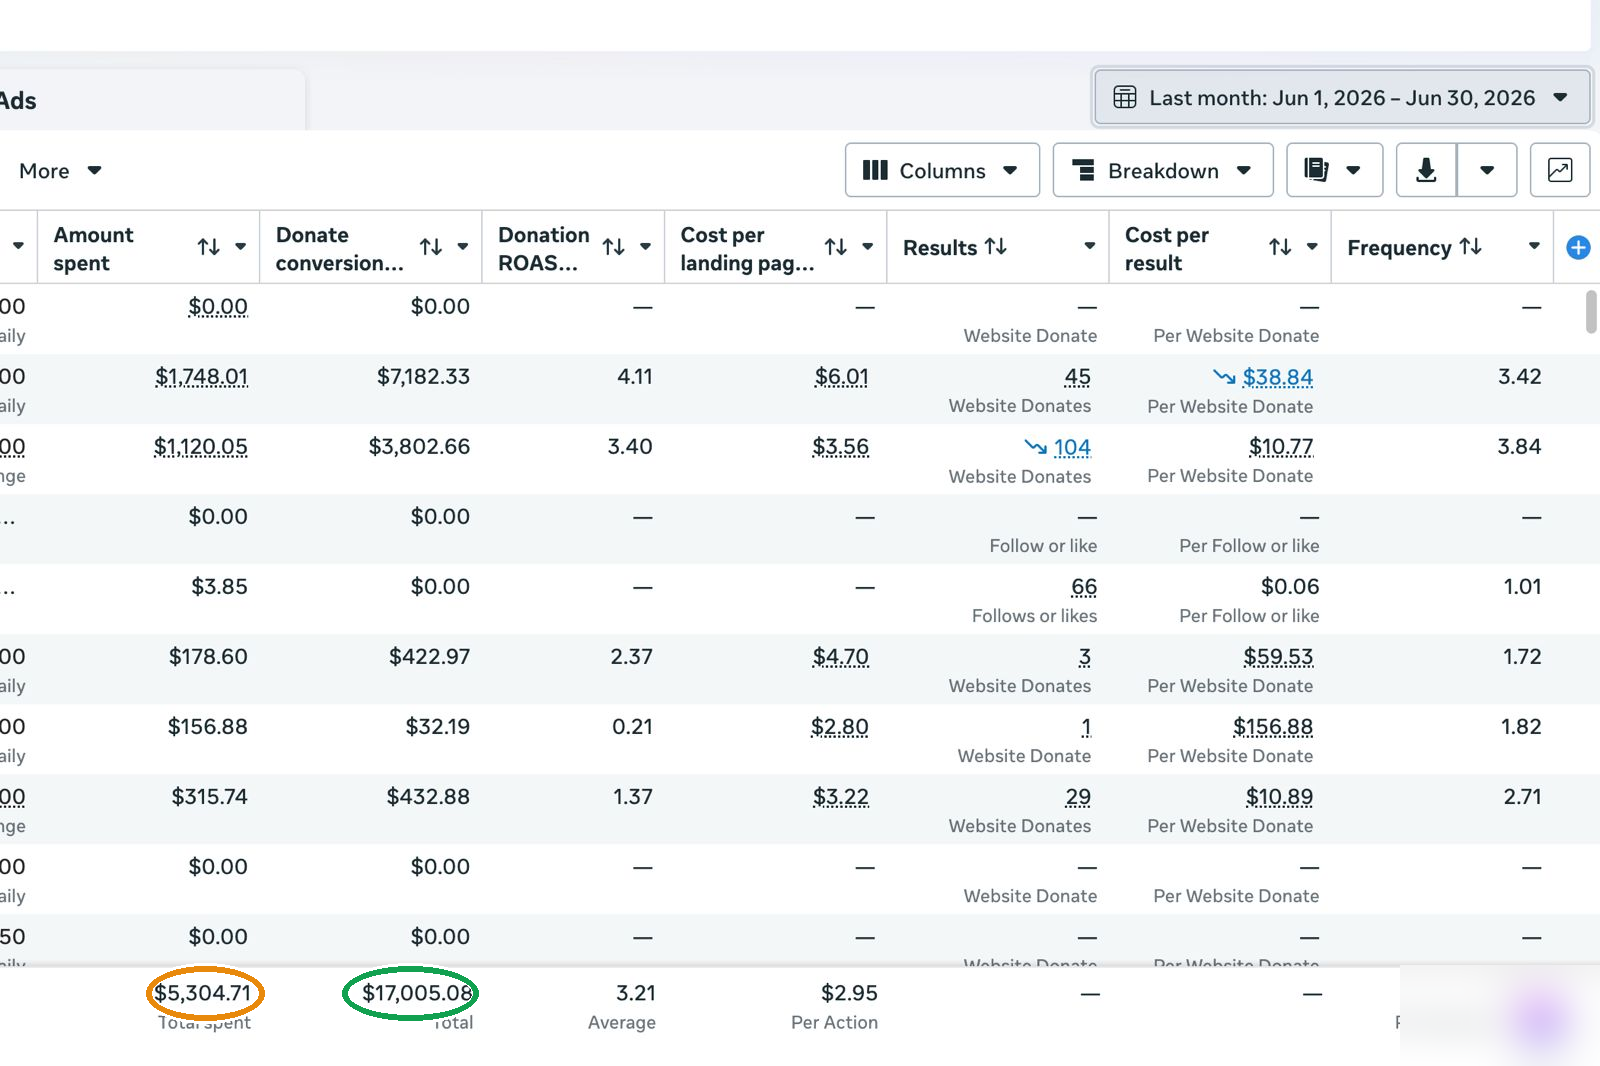
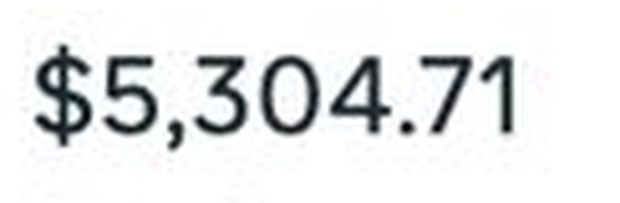
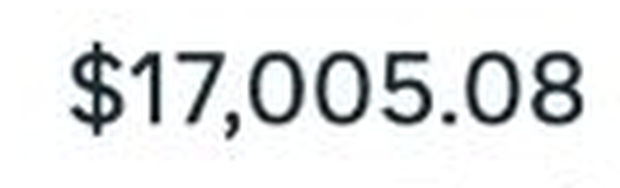
June 2026 · S$5,305 spent · S$17,005 in tracked donations · 3.2× return
How to read these numbers honestly
Two channels behave differently, and it matters. Google returns more per dollar because it captures people who were already looking for a cause like this one. Meta returns less per dollar but reaches further — it introduces the cause to people who had never heard of it, which is where next year's donors come from. Judging paid social by the search benchmark is the most common way charities talk themselves out of growth.
What makes both measurable is the unglamorous first step: the tracking and the donate flow. Without that, neither number above could be attributed to anything.
What we are not claiming
This is one charity, one month, one country. We can't promise the same for every charity — reach and return depend on your cause, your website, your donation platform and where you operate. A cause with broad public sympathy and a working donate page will outperform a niche cause with a broken one, and no amount of ad management changes that.
What we will do is tell you honestly, before you commit anything, what we think is realistic for you. That's what the free analysis is for.